- Data Integration
- Data Preparation,
How to Combine Data From Multiple Sources Without Coding: A Step-by-Step Guide
Combine data from multiple sources without coding. Learn when to append, merge, or blend datasets and avoid duplicate totals with a practical example.
- Published on
- Reading time
- 8 min read

In this article9 sections
Business data rarely lives in one place. Customer details might be stored in a CRM, sales transactions in spreadsheets, and support requests in another system. Each source provides useful information, but analyzing them separately makes it harder to understand the complete picture.
To combine data from multiple sources without coding, you need to identify the relevant datasets, prepare their fields, choose how the records should be combined, and validate the results. Visual tools such as Excel Power Query and supported no-code data platforms can help you perform these tasks without writing SQL or Python.
The important part is choosing the correct method. Adding rows, joining records, and relating datasets solve different problems.
This guide explains those methods, walks through a practical workflow, and shows how an incorrect join can inflate business figures even when the operation runs successfully.
What Does It Mean to Combine Data From Multiple Sources?
Combining data from multiple sources means bringing information from separate files, applications, or databases together so it can be used in a shared analysis.
For example, a business might have:
- A customer database containing names and customer IDs.
- A sales spreadsheet containing order IDs and transaction amounts.
- A support system containing customer inquiries and ticket IDs.
Individually, these sources answer different questions. Together, they can help the business compare purchasing activity with support interactions.
This process is related to data integration, but integration can cover more than creating one table. It may involve moving data, transforming formats, maintaining connections between systems, or preparing information for reporting.
A key distinction is that storing data together does not automatically make it suitable for analysis. Records must still be matched correctly, and the combined results must preserve their intended meaning.
Three Ways to Combine Data From Multiple Sources
Before selecting a tool, decide what kind of combination your data requires.
1. Append Data to Add More Rows
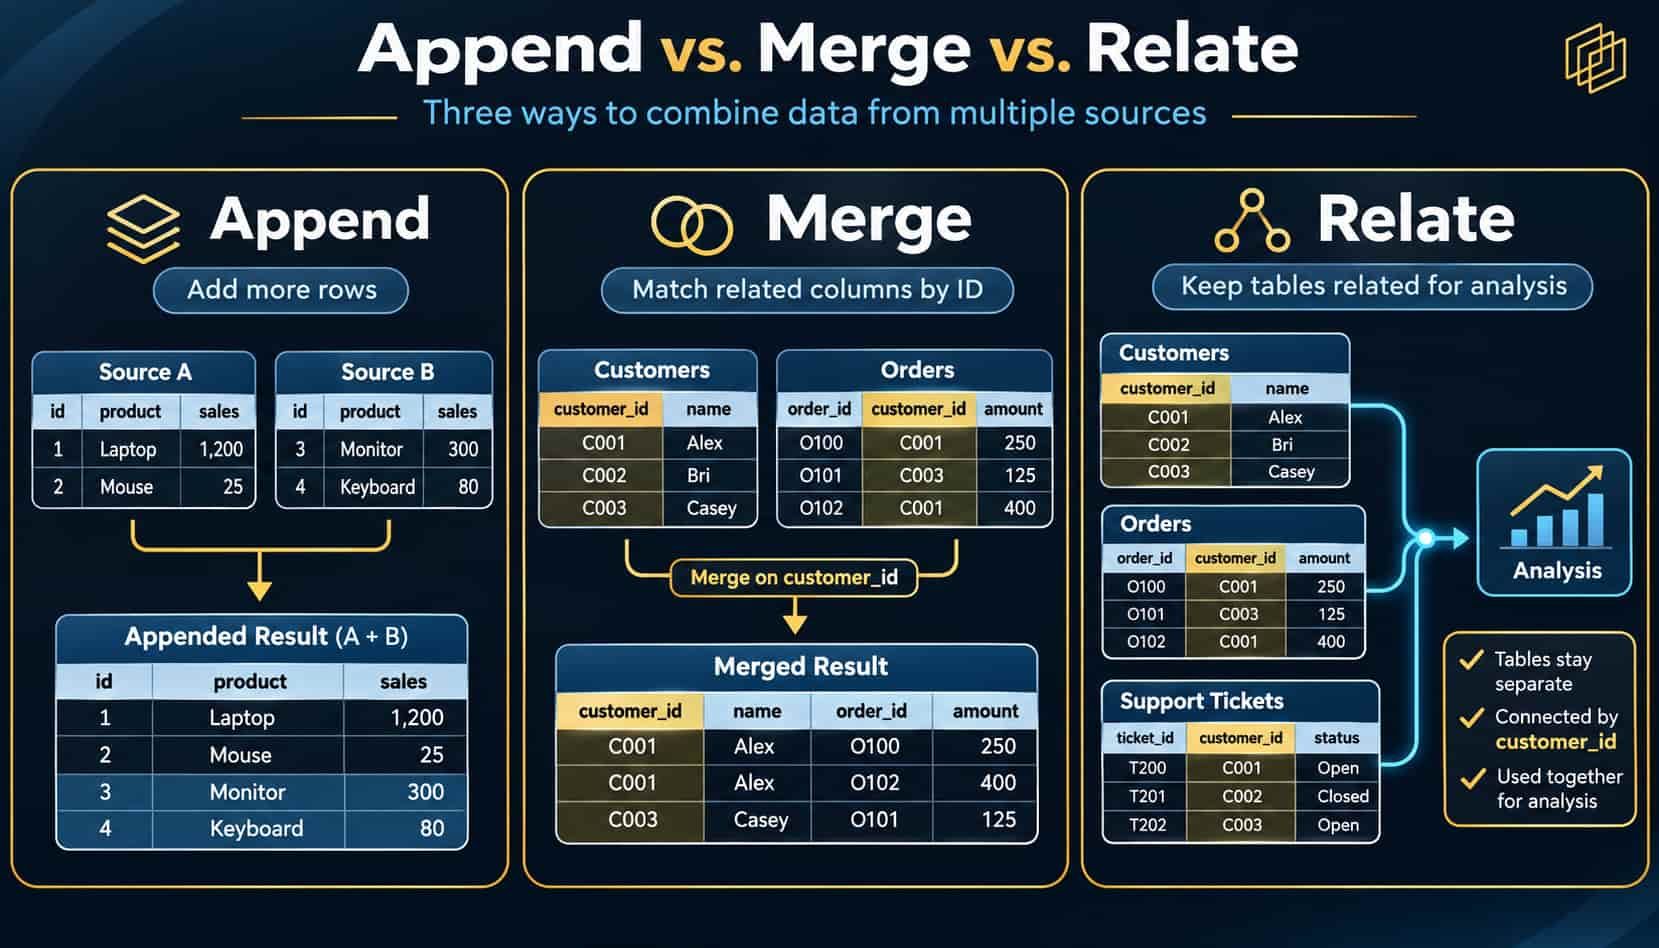
Appending is appropriate when datasets contain the same type of records and you want to stack them into a longer table.
Imagine a business with two spreadsheets:
- January orders: 200 records.
- February orders: 250 records.
If the columns are compatible, appending them produces a table with 450 records.
The main requirement is consistent field definitions. For example, an order_amount field should represent the same type of amount, currency, and accounting basis in both files.
In Microsoft Power Query, an append operation adds rows and aligns columns by name. If a column is missing from one source, the resulting table can contain null values for that field. See Microsoft's Append Queries documentation.
2. Merge or Join Data to Add Related Information
Merging is appropriate when different datasets describe related entities and share a field that can connect their records.
Suppose one table contains:
| customer_id | customer_name |
|---|---|
| C101 | River Co. |
| C102 | Cedar LLC |
A second table contains:
| order_id | customer_id | amount |
|---|---|---|
| O001 | C101 | $100 |
| O002 | C102 | $80 |
Joining these tables on customer_id can associate each order with its corresponding customer name.
However, the number of matching records matters. If one customer has several orders, joining customers with orders produces several rows for that customer.
The join type also affects the result. An inner join keeps matching records, while a left join keeps all records from the selected left table and adds matches where available. See Microsoft's Merge Queries documentation.
3. Relate or Blend Data for Analysis
Some analytics tools let you establish relationships among tables rather than physically merge all their columns into a single table.
This can be useful when datasets have different levels of detail. For example:
- A customer table has one row per customer.
- An orders table has one row per order.
- A support table has one row per ticket.
A relationship-aware data model can help preserve these distinctions during analysis.
In Tableau, for instance, relationships can retain the original tables' level of detail, while direct joins may create duplicated records. The exact behavior of relationships and blending depends on the tool and its configuration. See Tableau's Join Your Data documentation.
Which Method Should You Choose?
| Your situation | Suitable method |
|---|---|
| Combine monthly sales files with matching columns | Append |
| Add customer information to individual orders | Merge or join |
| Analyze orders and support tickets by customer | Relate tables or aggregate before joining |
| Combine records with incompatible formats | Clean and standardize first |
Rule of thumb: Append similar records, join related records, and consider relationships or aggregation when datasets have different levels of detail.
How to Combine Data From Multiple Sources Without Coding
The following six-step process applies broadly to spreadsheet and visual data-preparation tools. Exact menus and operations vary by platform.
Step 1: Define the Business Question
Start by identifying what you want the combined data to explain.
For example:
Which customers placed orders during the reporting period, and how many support tickets did each customer submit?
This question identifies the necessary data: customer records, orders, and support tickets.
It also identifies the reporting level. Because the business wants results by customer, the final summary should contain one row per customer.
That decision helps prevent problems later.
For more guidance on defining useful business questions, read From Data Overload to Strategic Focus.
Step 2: Identify and Import the Relevant Datasets
Locate the files or systems containing the required information.
Common sources include CSV files, Excel workbooks, CRM exports, database tables, and operational reports.
Import the datasets through your chosen tool's supported connection or upload options.
Before continuing, confirm that every source contains the expected fields and reporting period. Record when the data was exported, since datasets collected at different times may not be directly comparable.
Preserve the original source data so you can investigate discrepancies without losing the starting records.
Step 3: Check Structure, Identifiers, and Data Quality
Review the fields you plan to combine.
Pay particular attention to:
- Matching identifiers: Does
customer_idrefer to the same customer in every source? - Data types: Is the identifier stored consistently as text or a number?
- Formats: Do dates, currencies, and decimal values use compatible formats?
- Duplicates: Are repeated records legitimate transactions or accidental copies?
- Missing values: Are some customers or orders missing matching information?
Also check the granularity of each dataset: what does one row represent?
One row per customer is different from one row per order. Confusing these levels can create misleading totals after a join.
Step 4: Choose the Correct Combination Method
Use the structure of your data and the intended result to select the operation.
Append monthly order files if they contain compatible transaction records. Join orders with customer details when a reliable customer identifier connects them.
For a customer-level report involving both orders and support tickets, consider aggregating the transactions separately before joining their summaries.
Decide how to handle unmatched records as well.
For example, a left join starting with the customer table can retain customers who have no orders, while an inner join would exclude customers without matching order records.
Neither is universally correct. The appropriate choice depends on your business question.
Step 5: Combine the Data Using a Visual Tool
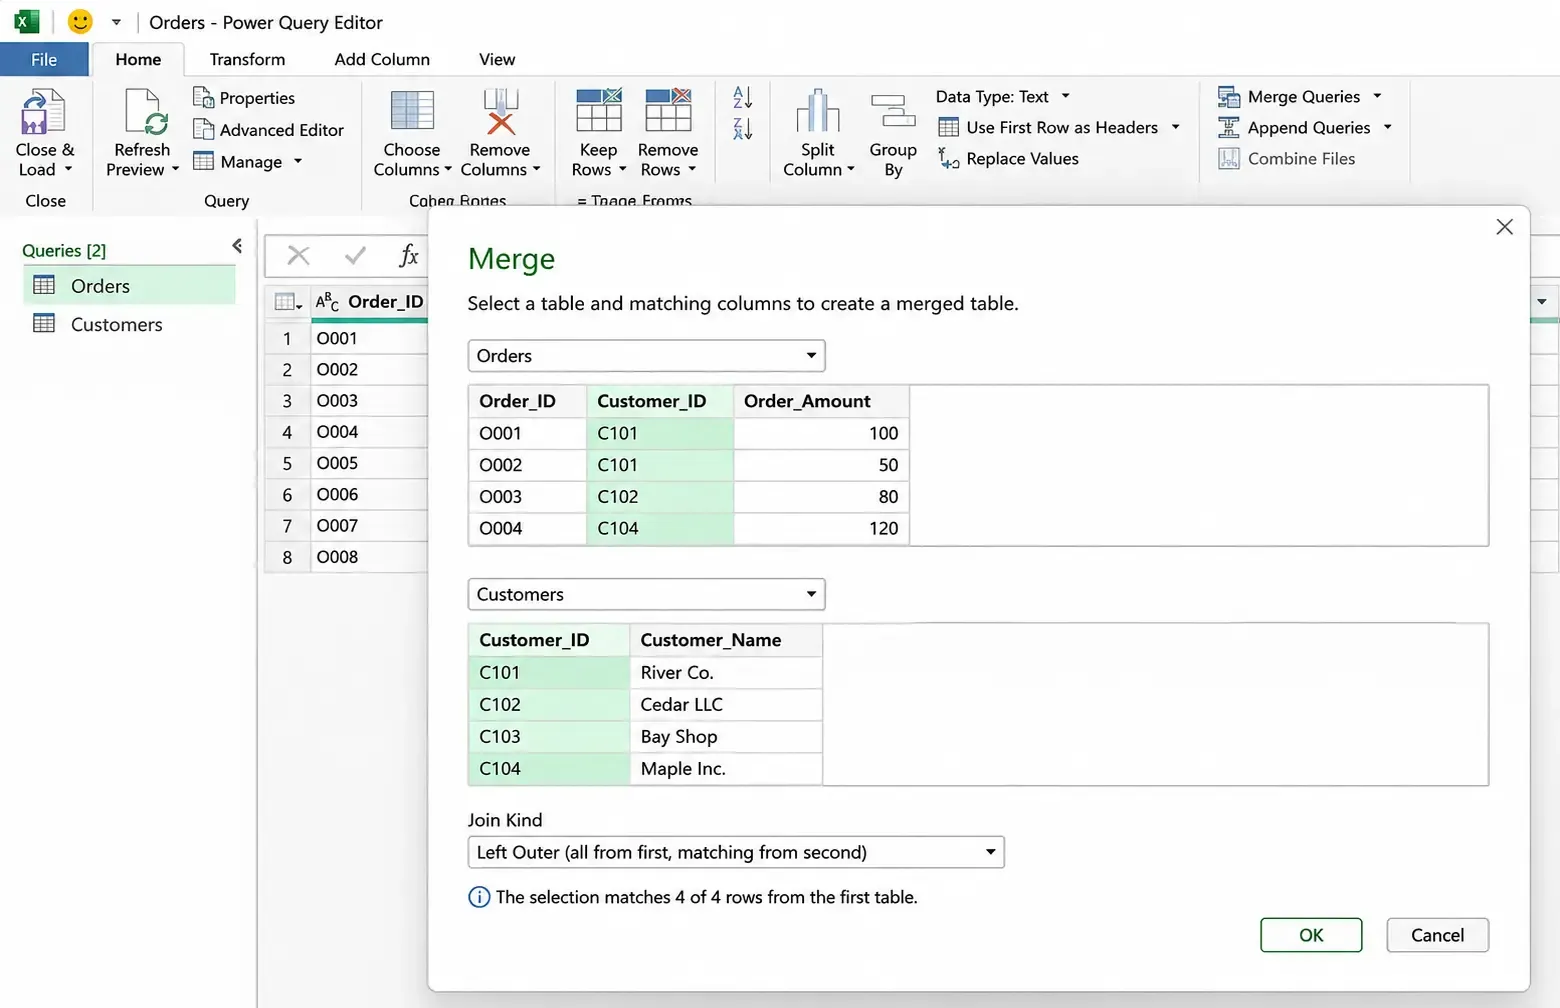
Many data-preparation applications provide visual operations for combining data.
In Excel Power Query, for example, you can:
- Import the relevant tables into Power Query.
- Use Home → Append Queries to stack compatible tables.
- Use Home → Merge Queries to match tables using selected columns.
- Expand the matching columns or aggregate results where appropriate.
- Review the output and load the prepared data for analysis.
These menu operations are documented by Microsoft. Available options and interfaces can vary by Excel version.
Other no-code platforms may offer data-combination operations through visual workflow blocks or data-modeling interfaces. Check whether your selected platform supports the specific sources, join behavior, and transformations you need.
Step 6: Validate the Combined Data
Never assume a successful merge means the resulting data is correct.
Compare the output with the source records.
At minimum, check that:
- Financial totals match the original transactions when they should remain unchanged.
- Record counts match the intended data relationships.
- Unique identifiers remain unique where required.
- Expected matches are present.
- Unmatched records are understood.
- Dates, units, and currencies are consistent.
For example, if the original orders contain $230 in total revenue, a customer-level summary should not show $380 unless there is a legitimate difference in the calculation or data scope.
The following example explains exactly how that error can happen.
Practical Example: Combining Customer, Orders, and Support Data
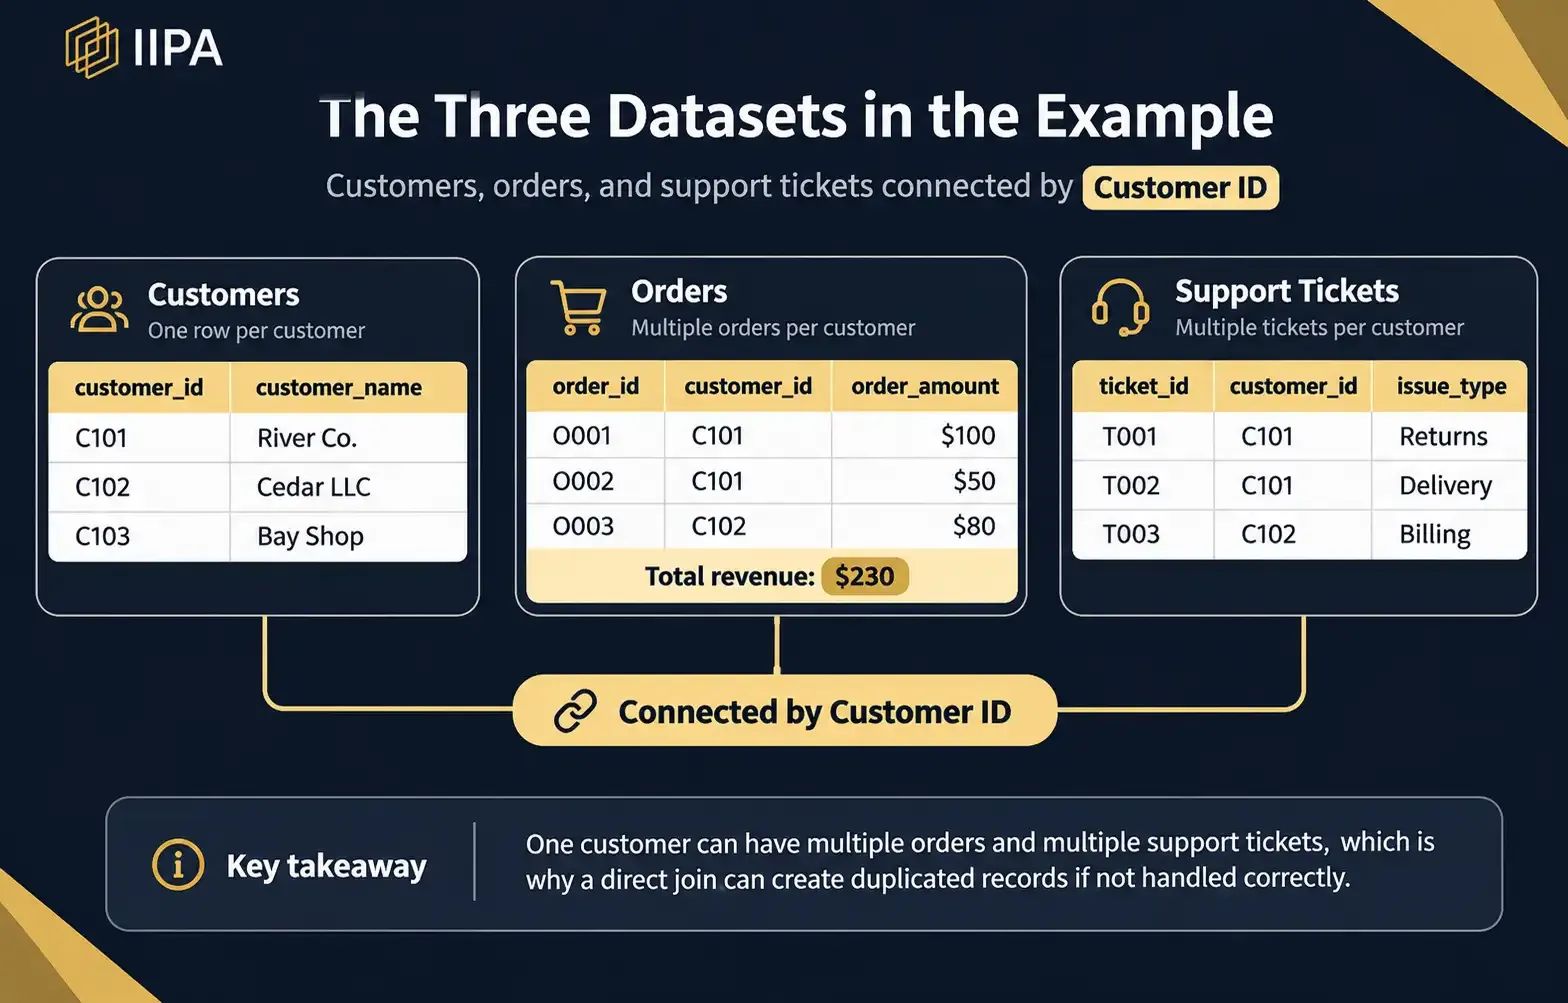
Imagine a small business that wants to answer this question:
How much revenue did each customer generate, and how many support tickets did they submit?
The business has three datasets.
All records and names in this example are fictional.
Dataset A: Customers
| customer_id | customer_name |
|---|---|
| C101 | River Co. |
| C102 | Cedar LLC |
| C103 | Bay Shop |
Each customer has one record.
Dataset B: Orders
| order_id | customer_id | order_amount |
|---|---|---|
| O001 | C101 | $100 |
| O002 | C101 | $50 |
| O003 | C102 | $80 |
The order amounts total $230.
Customer C101 has two orders, C102 has one, and C103 has no recorded orders.
Dataset C: Support Tickets
| ticket_id | customer_id | issue_type |
|---|---|---|
| T001 | C101 | Returns |
| T002 | C101 | Delivery |
| T003 | C102 | Billing |
Customer C101 has two tickets, C102 has one, and C103 has none.
The Problem: A Direct Join Can Inflate Revenue
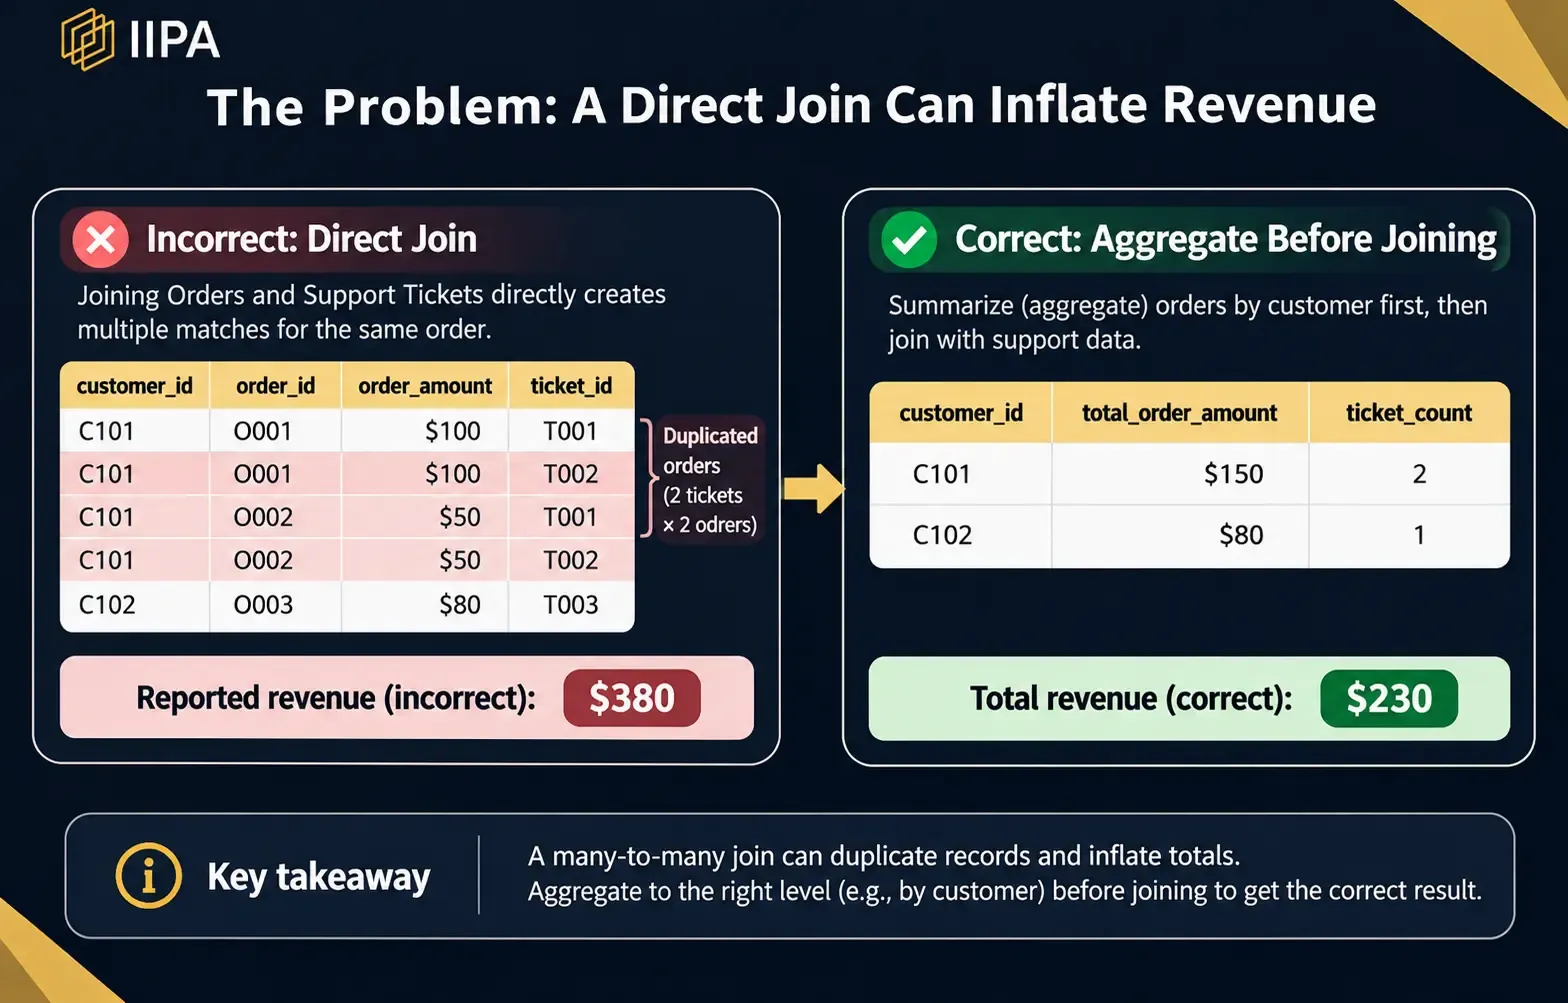
Suppose we join all three tables using customer_id and keep both order-level and ticket-level records.
For C101, two orders match two support tickets. The result contains four combinations:
| customer_id | order_id | ticket_id | order_amount |
|---|---|---|---|
| C101 | O001 | T001 | $100 |
| C101 | O001 | T002 | $100 |
| C101 | O002 | T001 | $50 |
| C101 | O002 | T002 | $50 |
| C102 | O003 | T003 | $80 |
If a left-join workflow starts with all three customers, C103 also remains in the output with empty order and ticket fields.
Summing the amounts in the displayed matched rows produces:
$100 + $100 + $50 + $50 + $80 = $380
But the original orders total only $230.
The join has repeated C101's transactions because two orders were matched against two tickets. These are additional combinations, not additional sales.
This is a recognized data-modeling problem. Tableau's troubleshooting documentation explains how joins can duplicate values and produce overcounted totals.
The Solution: Aggregate Before Joining
Because the business question asks for results by customer, summarize each transaction dataset at the customer level first.
From the orders table, calculate total revenue for each customer_id.
From the support table, calculate the number of tickets for each customer_id.
Then join those summaries to the customers table, ensuring each summary has no more than one record per customer.
The correct customer-level result is:
| Customer | Revenue | Support tickets |
|---|---|---|
| River Co. | $150 | 2 |
| Cedar LLC | $80 | 1 |
| Bay Shop | $0 | 0 |
| Total | $230 | 3 |
Here, zero means no activity is recorded in the selected source data and reporting period—not necessarily that a customer has never purchased anything.
The output preserves the original revenue total and provides a consistent customer-level summary.
The lesson: Before joining tables, identify what each row represents. When combining multiple one-to-many datasets, aggregate them to a suitable shared reporting level or use an appropriate relationship-aware model.
Common Problems When Combining Multiple Datasets
Even a correctly chosen combination method can produce poor results when the source data is inconsistent.
| Problem | Likely cause | What to check |
|---|---|---|
| Missing customer matches | Different or missing identifiers | Compare key values and data types |
| Duplicate records | Repeated imports or one-to-many joins | Inspect unique keys and relationship counts |
| Missing rows | An inner join excluded unmatched records | Review join type and unmatched IDs |
| Incorrect revenue totals | Transactions were duplicated during joining | Compare against original order totals |
| Inconsistent dates | Different formats or time zones | Standardize date definitions and types |
| Unexpected blank fields | Missing source columns or unmatched records | Review the source schema and match results |
| Incorrect financial comparisons | Different currencies, taxes, or reporting rules | Align business definitions before combining |
Avoid automatically deleting repeated rows. Two records with the same customer ID may represent two legitimate orders.
Similarly, a missing value should not automatically become zero. A blank sales amount may indicate missing information, while a verified absence of transactions can appropriately be represented as zero in a summary.
The goal is not simply a clean-looking table. It is a dataset whose values accurately represent the underlying business activity.
Excel vs. No-Code Data Integration Tools: Which Should You Use?
The right tool depends on your source systems, dataset complexity, reporting frequency, and team's experience.
Excel and Power Query
Excel is a practical starting point when data is already stored in spreadsheets or accessible files.
Power Query provides visual append and merge operations, along with data-preparation functionality.
It can work well when the task is manageable and the resulting process is easy to review. More complicated relationships or recurring workflows may require additional planning.
Visual Data Analysis Platforms
Some no-code analytics platforms let users connect supported sources, prepare data, and build analysis workflows through visual interfaces.
These can be worth evaluating when a team wants to move from data preparation into reporting or more advanced analysis without creating everything through custom code.
However, no-code does not mean that every database, connector, transformation, or refresh requirement will be supported.
Integration-Focused Platforms
Dedicated data integration tools may be suitable when an organization needs to move information repeatedly between applications, databases, or reporting destinations.
Such tools can offer a different emphasis from analysis-focused platforms. A system designed primarily for data movement is not necessarily the best environment for exploring and interpreting the resulting data.
Where IIPA Fits
IIPA focuses on helping organizations work with data through no-code analytical workflows.
Its website describes connecting files, databases, and device data, building analysis processes on a visual canvas, and viewing results through a dashboard.
For businesses exploring this approach, IIPA may be worth evaluating alongside their existing data tools.
Before selecting a platform, confirm that its current capabilities support your specific data sources, combination requirements, and operational needs.
Checklist Before Analyzing Combined Data
Before using a combined dataset in a report or business decision, verify the following:
The business question and reporting period are clear.
Every matching field refers to the same entity across sources.
Data types, formats, and business definitions are consistent.
Record counts reflect the intended relationships.
Unexpected duplicates and missing matches have been investigated.
Financial and operational totals reconcile with source records.
Sensitive data is handled according to applicable access and privacy requirements.
The combination process can be explained, reviewed, and repeated.
Once the combined data passes these checks, you can move on to analyzing business data without coding.
Frequently Asked Questions
How do you combine data from different sources in Excel?
Excel Power Query supports combining data through appending and merging.
Use Append Queries when you need to stack compatible records from multiple tables. Use Merge Queries when you need to match records through shared columns, such as customer IDs.
Before loading the result, confirm the data types, join type, row counts, and calculated totals.
What Is the Difference Between Data Blending and Data Integration?
Data integration is a broad term for bringing information from different sources together so it can be used consistently.
Data blending generally refers to combining information from separate datasets for analysis, often within a reporting or visualization environment.
The exact distinction depends on the platform. Some tools use relationships, joins, and blending as separate concepts with different behavior.
Can I Combine Databases Without SQL or Python?
Yes, some tools provide visual interfaces for connecting supported databases, matching fields, and applying transformations without manually writing SQL or Python.
However, advanced transformations, unusual data structures, or unsupported sources may still require technical expertise.
Check a platform's documentation before assuming it supports your specific workflow.
How Can I Prevent Duplicate Records When Merging Datasets?
Start by identifying whether each matching field is unique.
If both datasets contain multiple records for the same identifier, a direct join may create additional combinations.
To avoid misleading totals, consider summarizing each dataset at a shared level of detail before joining, or using a relationship-aware data model that handles the intended analysis correctly.
Always compare the output with the source records.
Can I Combine Data From Different Business Systems Automatically?
Some data integration and analytics tools support scheduled data imports, refreshes, or repeatable workflows.
The available automation depends on the systems involved, the tool's connectors, and its supported configuration.
Even an automated process needs validation, monitoring, and appropriate handling of failed imports or changed source structures.
Conclusion: Combine Data Correctly Before Analyzing It
Combining data from multiple sources without coding is achievable for many common business tasks. But the quality of the result depends on understanding how the datasets relate.
Append when you want to add compatible records, join when you want to connect related information, and consider relationships or aggregation when datasets contain different levels of detail.
Most importantly, verify the output before relying on it. A successful data-combination operation is not automatically an accurate analysis.
If your organization wants to explore visual workflows for connecting and analyzing business data, explore IIPA's no-code data analysis platform or contact the IIPA team to discuss your specific requirements.